My Journey Creating A Data Pipeline
My Journey Creating A Data Pipeline
Step 1: LinkedIn
I needed some recurring data for this project, so I decided to scrape the first page of the SRP of LinkedIn. The first page is a technical limitation. I would probably have to implement a much more sophisticated scrapper to account for how LinkedIn’s pagination works.
Applied Filters: (URL: https://www.linkedin.com/jobs/data-analyst-jobs-atlanta-ga?position=1&pageNum=0&f_TP=1&distance=25&sortBy=DD)
- City: Atlanta, GA
- Distance Radius: 25 Miles
- Sort By: Most Recent
- Date Posted: Last 24 Hours
For each result I capture the Job Title, Company Name, Location, DateTime of Posting, and URL. The data for the day is then exported as a CSV. After daily CSV is created it is then combined with CSV files from previous days to create a complete dataset.
Step 2: Google Cloud Services
Uploading CSV to Google Cloud Storage
I connect to the Google Cloud Storage API, create a bucket name, and specify the source file and the destination path for Google Cloud Storage. The code is mostly unchanged from Google’s demo code. I did wrap it in a function for better organization and had to add authentication.
This being my first time using the Google Cloud Platform, it was a bit unintuitive that I couldn’t load data directly to Big Query. However, it made more sense after I realized the extensibility of Google Cloud Storage.
Google Cloud Storage to Big Query
When I was researching this project, I got the impression from various sources that I couldn’t append data to a Big Query data set. So I built my processes on that assumption. I later found out that wasn’t completely true, but I didn’t want to rewrite my code completely. I was digging through the documentation for bigquery.LoadJobConfig, I found a beneficial parameter name “write_disposition” that allows users to overwrite data versus appending data.
Outside of the small hiccup, the transfer to Google Cloud Storage to Big Query is fairly standard.
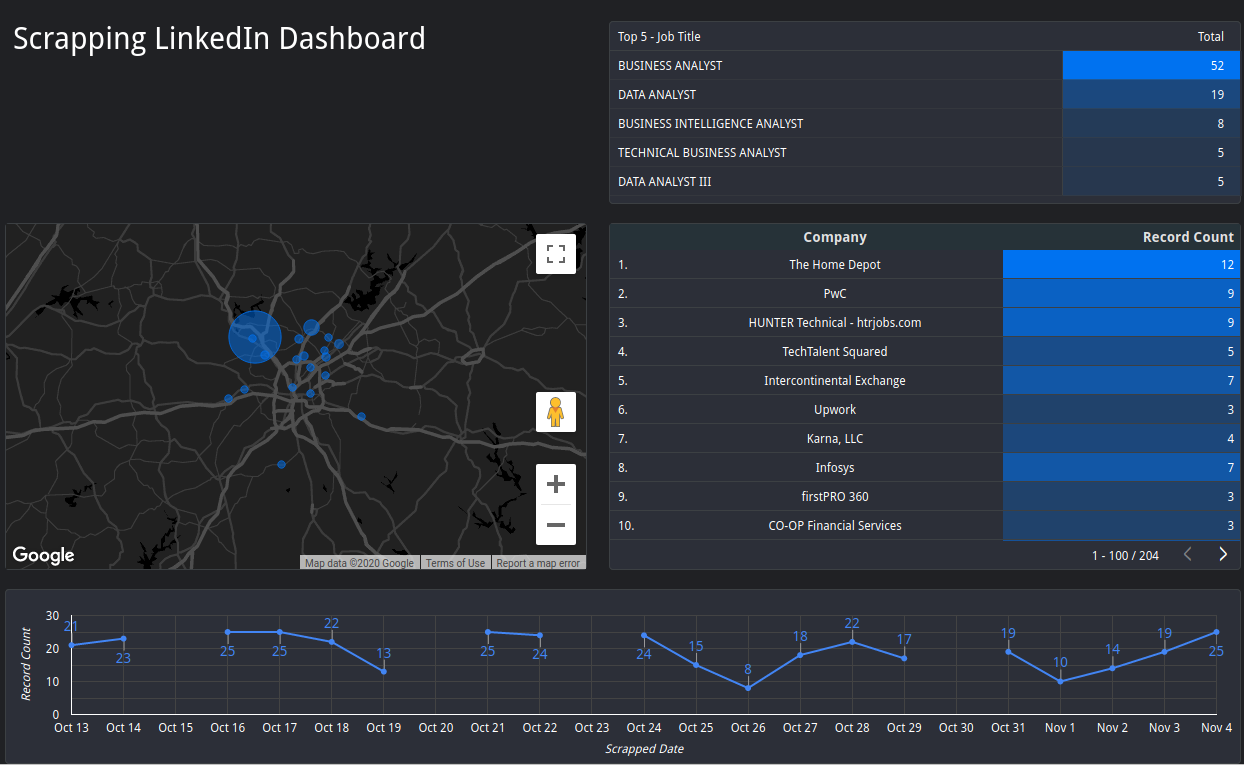
Step 3: Displaying Data in Google Data Studio
While I was planning this project out, I wanted something to show for my efforts. So I figured I would create a dashboard on Google Data Studio that would keep track of high-level analytics. It also gave me a visual interface for troubleshooting.
There are notable gaps in the data. I didn’t implement automation through Linux’s crontab until October 21st. On the 23rd, the program script no longer worked, and I finally did the responsible thing and added error handling to the scrapper. On October 30th, I had a power outage.
Conclusion:
If I had to start from scratch, I would certainly add error handling from the start. I would also plan a better schema for my data types. Midway through, I switched from a date to date-time format for the execution date field, causing some headaches. Additionally, if the cost weren’t too high, I would further investigate running the code in a cloud environment. It started to make sense to me what makes “the cloud” so appealing to companies. The feature set is complete, and it adds a level of redundancy and professional support for smaller and mid-sized companies.