Power BI Visualizaiton - Customer Success Dashboard
At the time of writing, I am the Customer Success Data Analyst at RentPath. A portion of my job consists of ensuring that our Managers and our ~21 different team members are informed about current our current caseload, customer satisfaction, and the number of cases closed in the present day. I utilized PowerB BI, our data warehouse, and the Salesforce API to create a hybrid refreshing report(Some portions are near-realtime other metrics, mainly the “% of time not ready”, can only be updated daily).
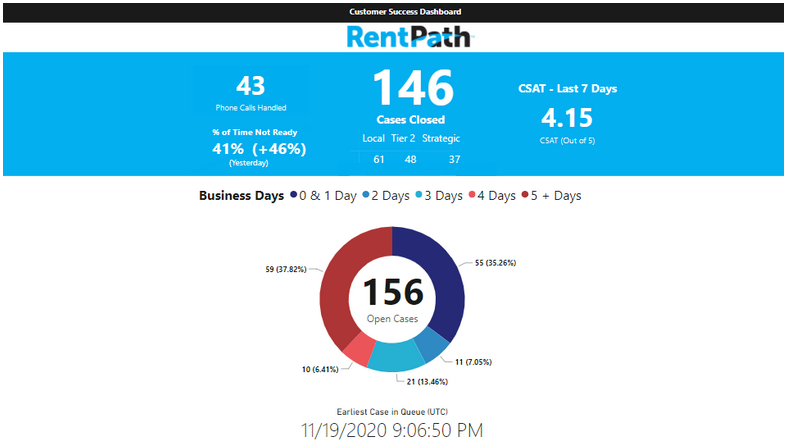
Customer Success Television Dashboard
Purpose:
This visual is displayed on the Customer Success floor on large monitors and provides a high-level status to all ~21 customer success team members regarding some key metrics. It is designed to be simple and quickly digested by non-technical stakeholders.
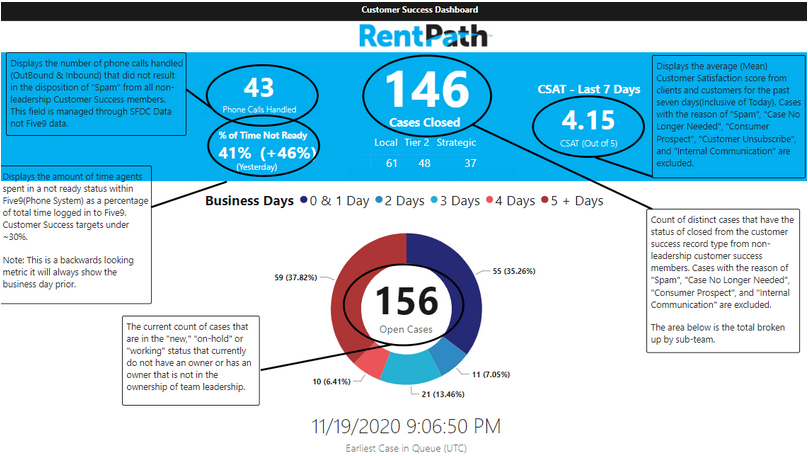
Annotated Version:
Underlying Data Model:
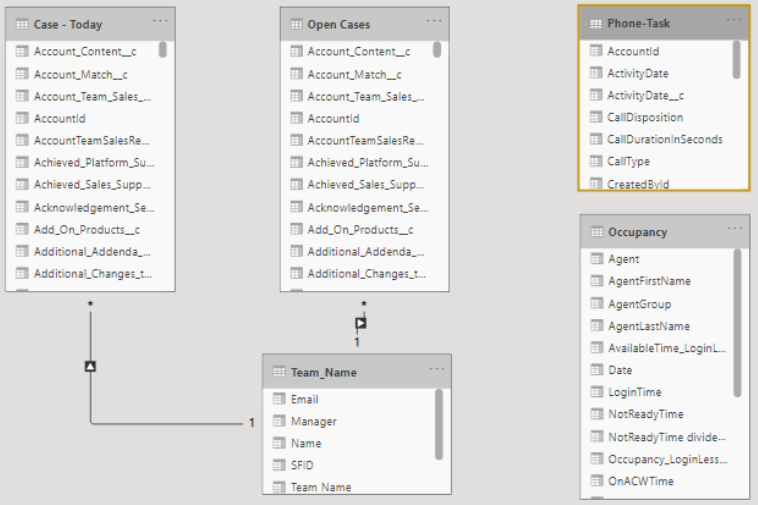
Source - Salesforce API:
- ‘Case - Today’ - Queries the Salesforce API for cases that were handled today. I count the number of cases that have a status of “Closed” to generate “Cases Closed.”
- Open Cases - Queries RentPath’s Salesforce API for all cases with a record type of “Customer Success” and status not set to “Archive” or “Closed.”
- The ‘business days’ dimension buckets cases by the amount of time (in business days; defined as 8:00 AM - 5:00 PM).
- This is used for the CSAT metric. Each case has metadata about the results of our CSAT surveys. This data source is also used to generate the open cases (#).
- ‘Phone - Task’ - Our Salesforce instance is set up to generate a ‘task’ whenever the phone is used. The number of tasks generated by our team is aggregated throughout the day to generate the number of phone calls handled.
Source - Google Sheet:
- Team_Name: Used to split cases closed by sub-team. I manually define this data source following company business logic. It is hosted on Google Sheets and used across multiple dashboards.
Source - Data Warehouse:
- Occupancy - Pulled from RentPath’s data warehouse. Data is pipelined from Five9 (A contact center phone solution) using FTP and some custom scripts. Used to calculate the percent of time agents were not ready to take phone calls.